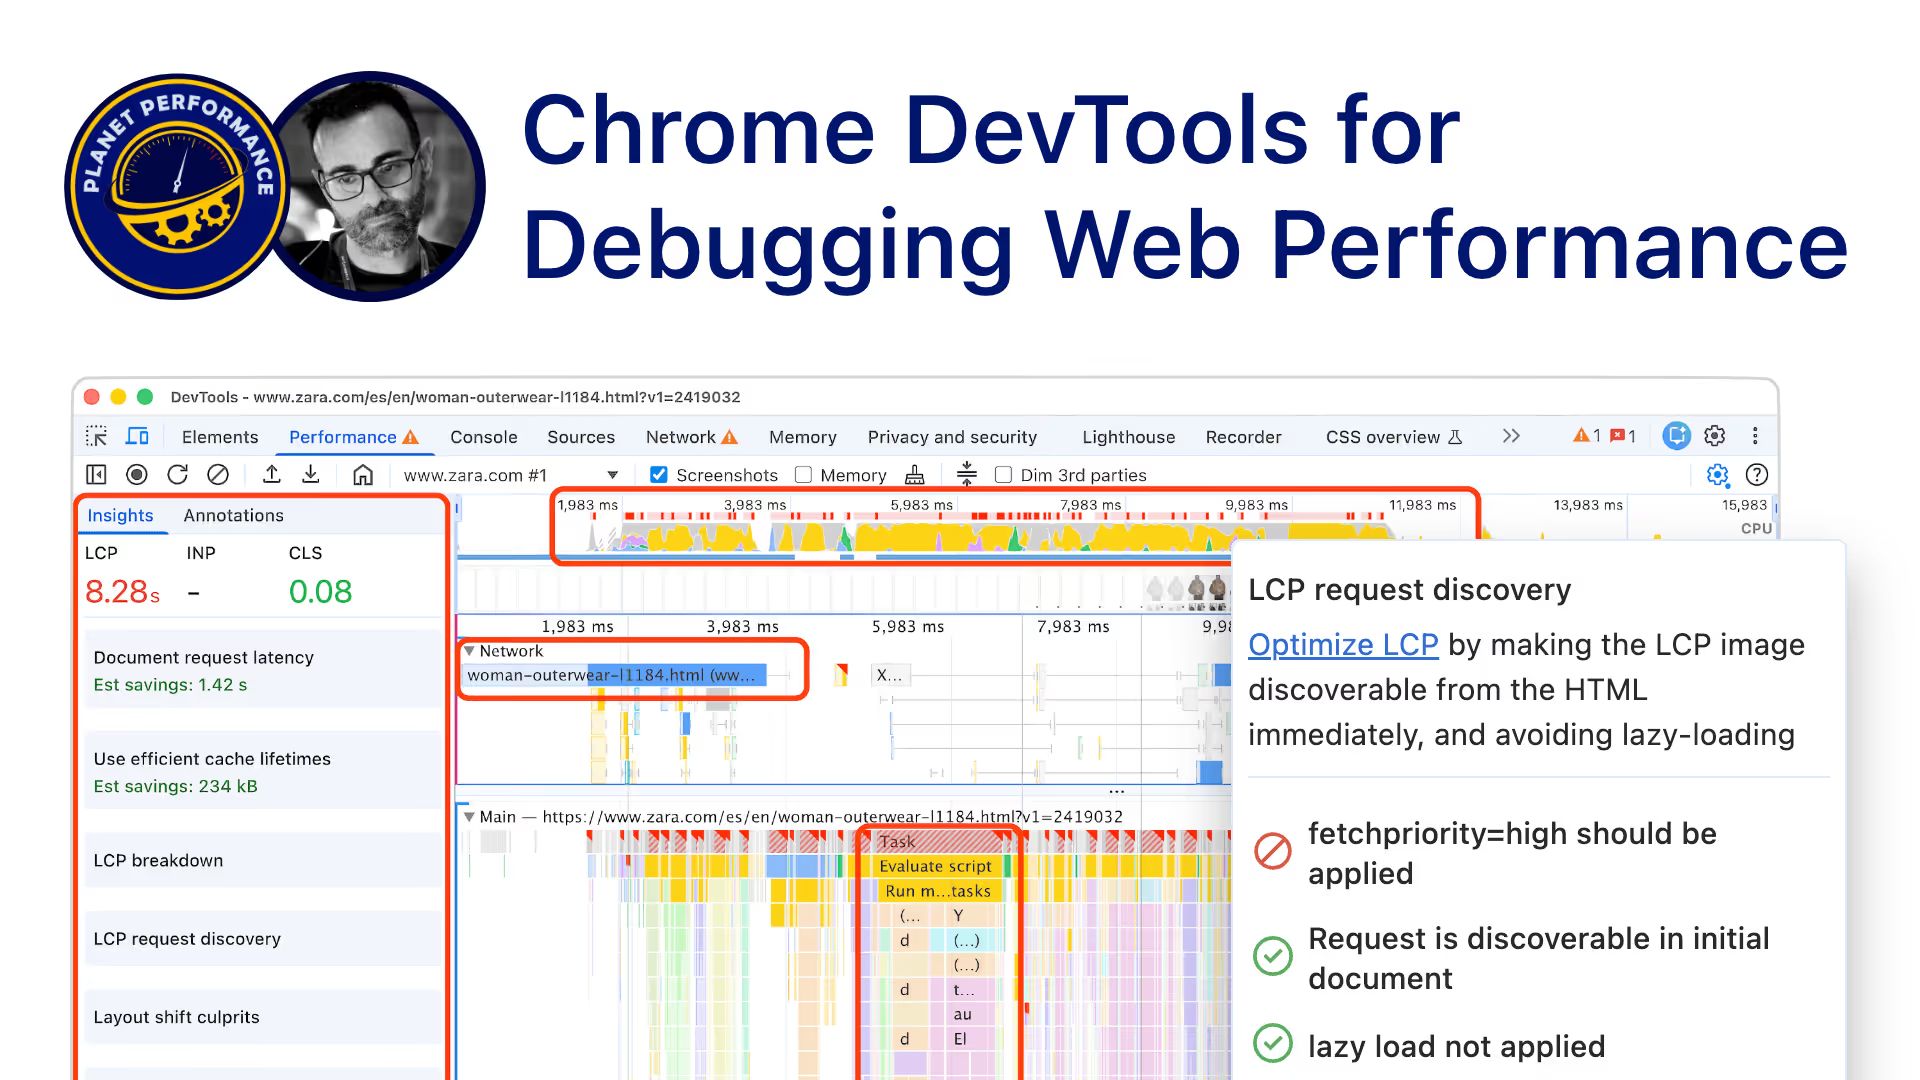
Joan León shares a hands-on workflow: spot heavyweight requests and weak caching in Network, compare local metrics with CrUX live Core Web Vitals, and use Performance Insights and traces to pinpoint LCP, CLS, and INP regressions. He also highlights snippets, content-visibility and adds a quick video optimization with HandBrake as a bonus.
calendar.perfplanet.com/2025/chrome-devtools-for-debugging-web-performance
