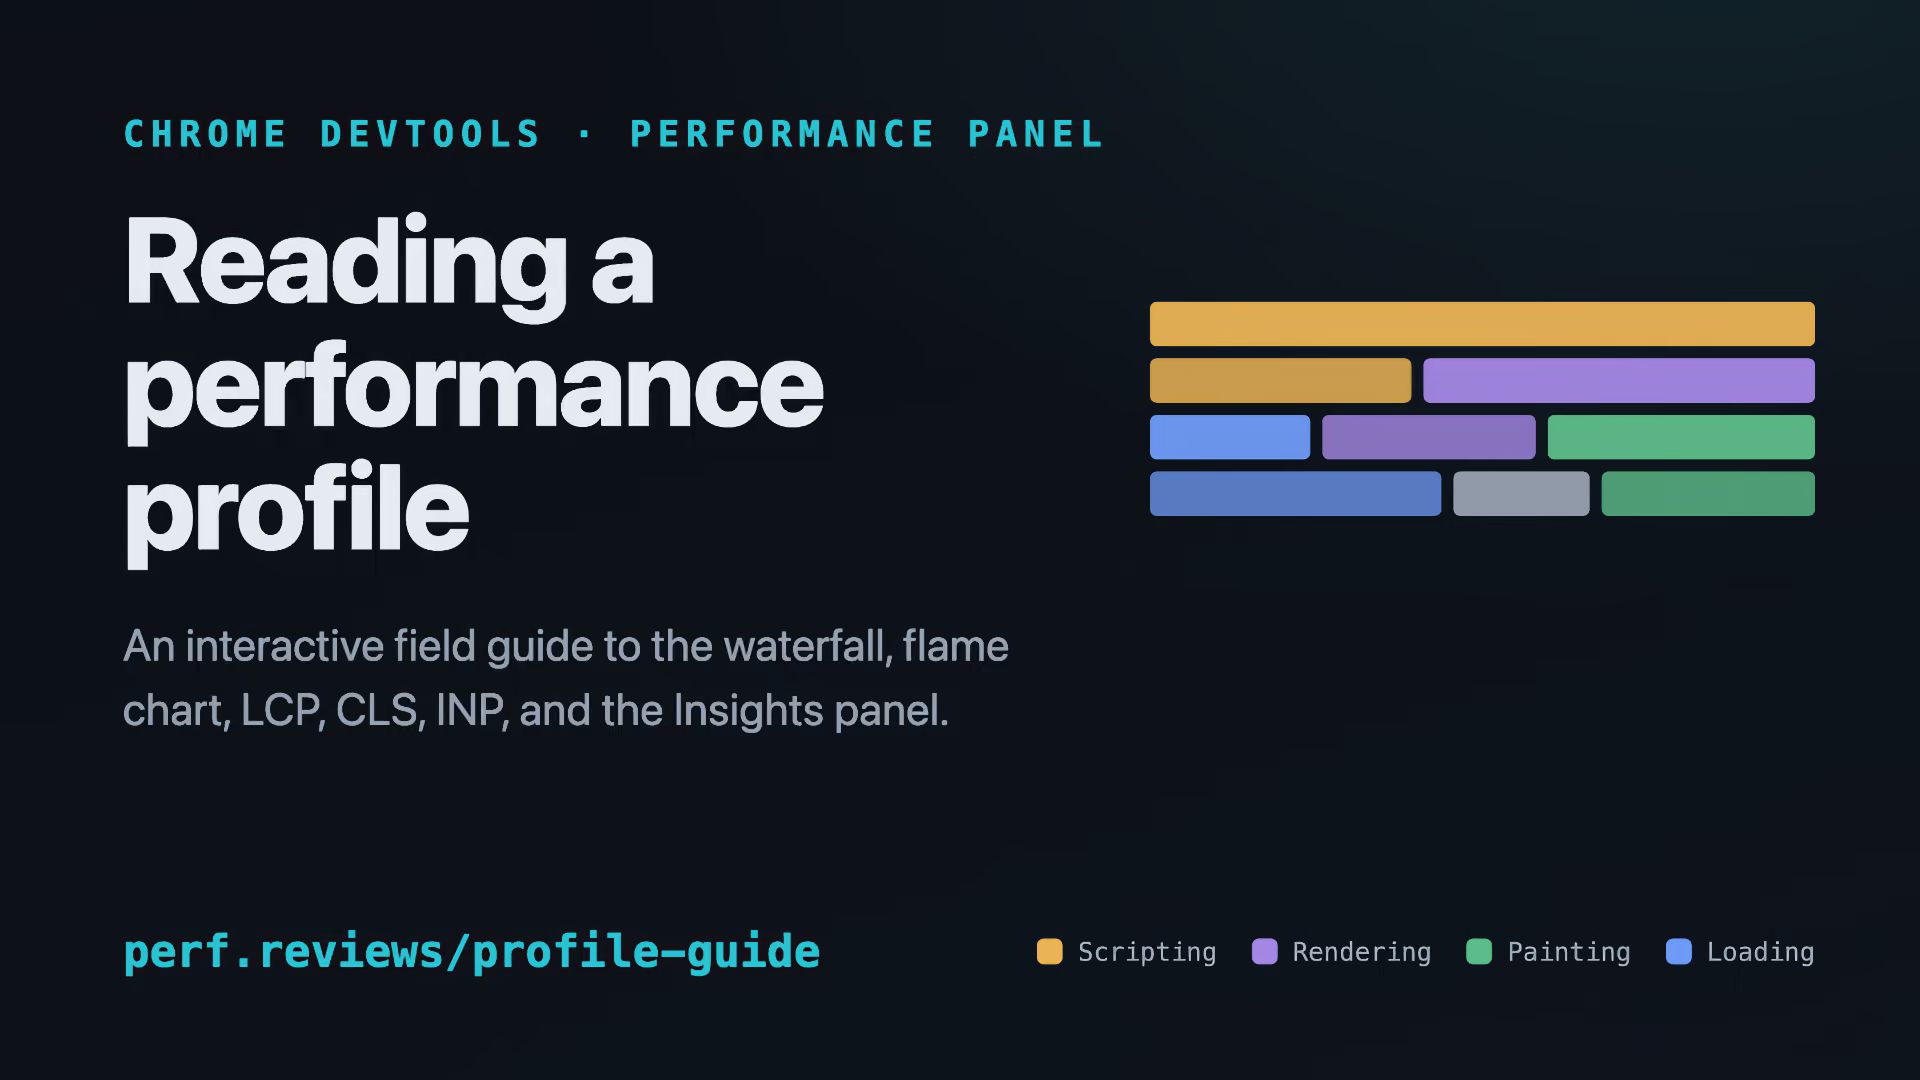
Joan León uses interactive figures to walk through the colors of scripting, rendering, painting, loading, and idle work, the anatomy of a network request bar, and the two axes of the flame chart with self time versus total time. It also covers the four LCP phases, layout shifts, INP, compositing, and tables of common function and request signatures.
Field guide to the Chrome DevTools Performance panel